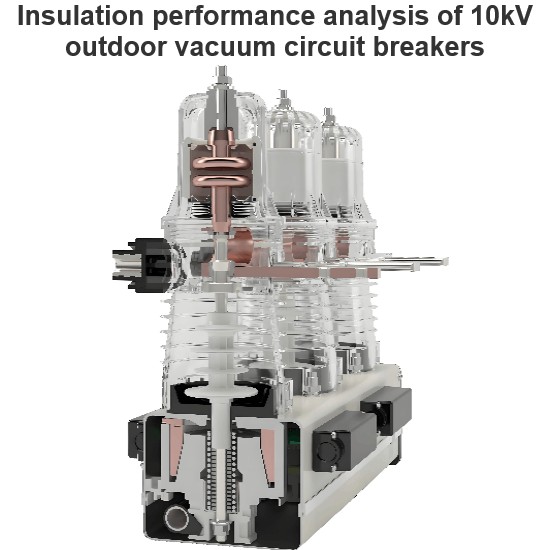
Outdoor vacuum circuit breakers (referred to as breakers hereinafter) are widely used in the distribution network due to their advantages such as small size, light weight, fire - and explosion - proof nature, smooth operation, low noise, small open - contact clearance, short arcing time, and easy maintenance. As atmospheric pollution becomes increasingly severe, in adverse weather conditions like heavy fog, drizzle, condensation, or ice melting, partial discharge (PD) is likely to occur on the surface of the breaker's post insulator. This can even lead to flashovers, shortening the service life of the breakers and affecting the safe and stable operation of the power system.
In this paper, the ZW32 - 12 outdoor - pole - mounted high - voltage vacuum circuit breaker (hereafter referred to as the HV ZW32 - 12 breaker) serves as an example, undergoing tests in diverse climatic conditions. The surface discharge process of the post insulator of the ZW32 - 12 breaker is captured by a UV imager, while its discharge quantity is simultaneously measured. Following the image processing of the UV images, characteristic parameters are extracted to depict the features of these images. Subsequently, the discharge quantity is computed using the least - square support vector machine method, enabling the calibration of the UV images. This represents a novel non - contact detection technique for the partial discharge of breakers.
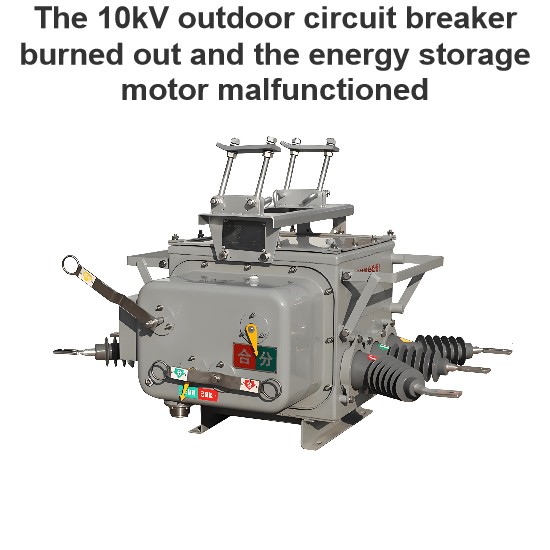
The ZW32 - 12 breaker is a three - phase, 50Hz, 12kV AC outdoor power - distribution device. It is primarily employed to interrupt and close load current, overload current, and short - circuit current. Its structure is illustrated in Fig. 1.

To simultaneously capture the discharge UV image of the post insulator and measure the partial discharge (PD) quantity, an insulator surface discharge test system is designed, as depicted in Fig. 2. In Fig. 2, T represents the voltage regulator, B is the step - up transformer, R₁ is the limiting resistor, and C₂ is the coupling capacitor, which is utilized for sampling the PD measurement.

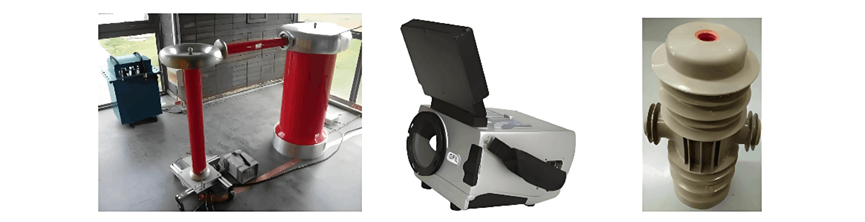
The transformer employed in the system is a YDWT - 10kVA/100kV model, as illustrated in Fig. 3 - a. It is utilized to generate the high - voltage source required for the insulator.
An OFIL Superb UV imager is used to capture the UV images of the insulator surface discharge, as shown in Fig. 3 - b. The test sample is the post insulator from a ZW32 - 12 breaker, which has been in service for three years, as depicted in Fig. 3 - c. The sample is placed within an artificial climate chamber, where the relative humidity can be stably controlled.
In this system, the pulse current method is adopted to measure the partial discharge (PD) quantity. The console controls the voltage regulator and transformer to generate the desired voltage. Subsequently, the PD signal is transmitted to the PD detector JFD - 3 via a coupling capacitor and a detecting impedance.
Through intermittent humidification, the relative humidity within the artificial climate chamber can be maintained at a stable level. Insulators are exposed to a voltage for two hours to ensure they are thoroughly wetted. Then, a 12kV voltage is applied to the insulator for 5 minutes. During this period, UV images are captured, and the PD quantity is measured. The UV imager's shooting distance is 5 meters, with an angle of 0° and a gain of 110%. Repeated tests are conducted at each relative humidity level, which ranges from 70% to 90%, with a step - up process of 5%.
Process of uv images
The UV imager captures a video, so frame processing is necessary to obtain successive frames of the UV video for further analysis. Each image frame is an RGB true - color image [3]. The insulator's surface discharge is reflected on the UV image as a bright spot. The more intense the surface discharge, the larger the spot area. Therefore, image pre - processing and image segmentation are essential steps to filter out the image background and extract the spot part.
Since the red component (R), green component (G), and blue component (B) in the RGB color space only indicate the color ratio of red, green, and blue and cannot represent the image's brightness, we analyze each image frame in the HSL color space. HSL stands for Hue, Saturation, and Luminance respectively. The HSL components of an image frame are shown in Fig. 4. According to Fig. 4, we can determine that the H or S component is unable to distinguish the spot from the background, while the L component can perform this discrimination [4].
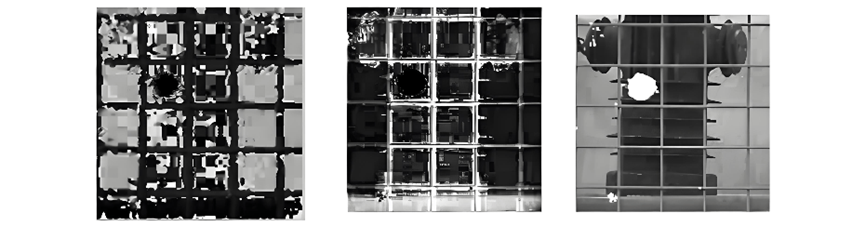
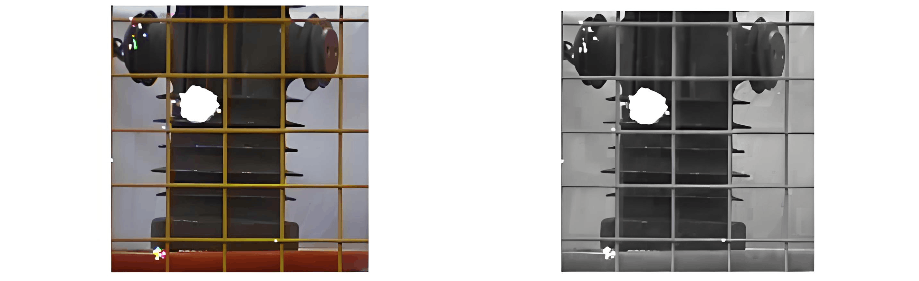
As can be seen from Fig. 4 - c, the L component of the spot part is greater than that of the background. Therefore, threshold segmentation is an effective method for extracting the spot part. The key lies in choosing an appropriate L - component threshold. Here, we use Otsu's thresholding method to calculate the L - component threshold [5]. After implementing Matlab coding for Otsu's method, the optimal L - component threshold is determined to be 216, and the segmentation result is presented in Fig. 5 - c. It is evident that the background has been filtered out, leaving only the UV spot part.
As shown in Fig. 5 - c, apart from the UV spot part, there are still numerous small noise points. To address this, we apply mathematical morphology operations with a structural element in the form of a circle having a radius of 4 pixels to remove these noise points [6]. After the mathematical morphology processing, the result is shown in Fig. 5 - d. All noise points have been eliminated, and only the spot part remains. We define the number of pixels in the spot part as the "facula area" of this UV image.

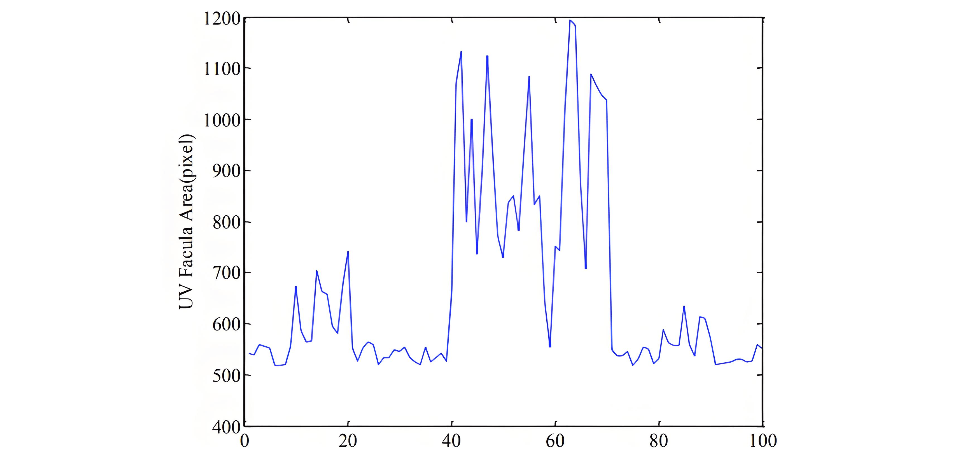
After computing the facula area for consecutive frames in a UV video, we can obtain the facula area curve. The facula area curve at 85% humidity is shown in Fig. 6. As indicated by Fig. 6, the facula area fluctuates within a small range, with a large - sized spot emerging occasionally. Therefore, three parameters are defined to characterize the discharge intensity: the mean facula area, the intermittent facula area, and the repetition times of intermittent facula respectively [7]. We select 100 consecutive frames following the occurrence of partial discharge as the objects of study. The mean facula area is the average of the areas of 100 frames' faculae. The intermittent facula area is the average of the areas of faculae that are larger than the mean facula area, while the repetition times of intermittent facula is the number of faculae with an area larger than the mean facula area. According to Fig. 6, the mean facula area is 665 pixels. The intermittent facula area is 902 pixels. The repetition times of intermittent facula is 32.
Once the three characteristic parameters are calculated and the partial discharge (PD) quantity is measured synchronously, we attempt to determine the PD quantity using these three UV image parameters through the least - square support vector machine method.
Ninety samples of UV videos are selected. For each frame of these samples, three UV image parameters are calculated, and the corresponding partial discharge (PD) quantity is recorded by the JFD3 PD detector. The input arguments for the vector machine are chosen as the mean facula area, the intermittent facula area, the repetition times of intermittent facula, and the relative humidity. The output argument is the PD quantity. The Radial Basis Function (RBF) is selected as the kernel function. After normalization, 80 samples are utilized for training. Both the kernel parameters and the punishment parameters of the vector machine are set to default values. The training result is depicted in Fig. 7.
As shown in Fig. 7, for most of the training samples, the error compared with the measured PD quantity is relatively small. However, for some samples, the error exceeds 20%. The Mean Square Error (MSE) is calculated as follows:
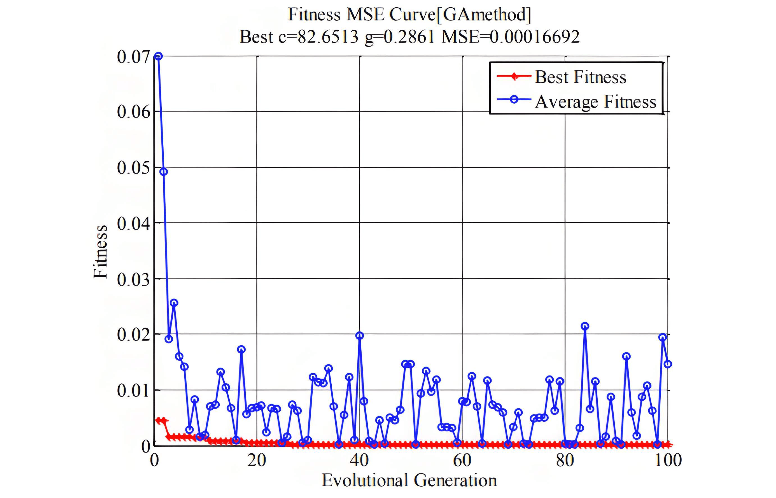
To minimize the Mean Square Error (MSE) of the regression result and enhance the accuracy of the vector machine, a genetic algorithm (GA) is employed to optimize the kernel parameters and punishment parameters. [8 - 9]
The termination generation is set to 100, and the population size is set to 20. The optimization process is illustrated in Fig. 8. As shown in Fig. 8, after 30 generations of evolution, the MSE decreases from 0.07 to 0.01, indicating that the genetic algorithm has reached its optimal point. [10] The optimized kernel and punishment parameters are 0.2861 and 82.65 respectively.
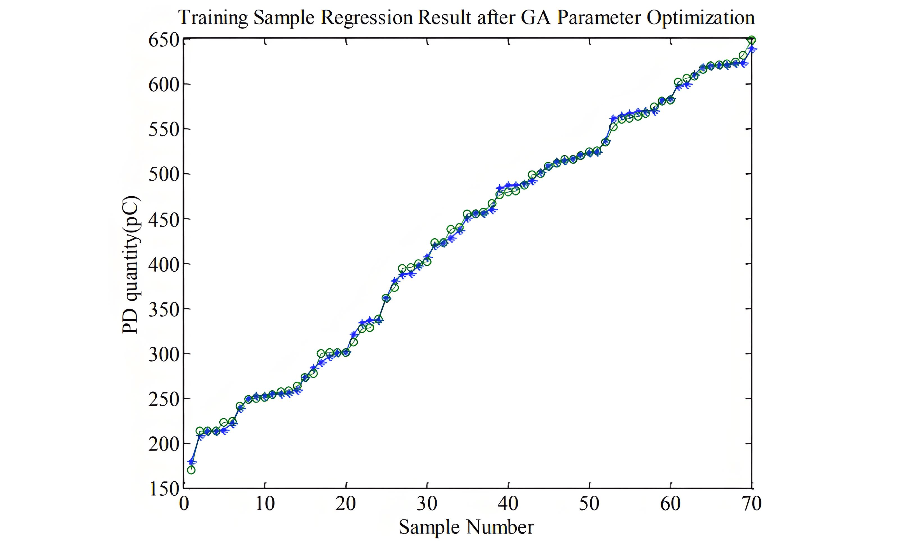
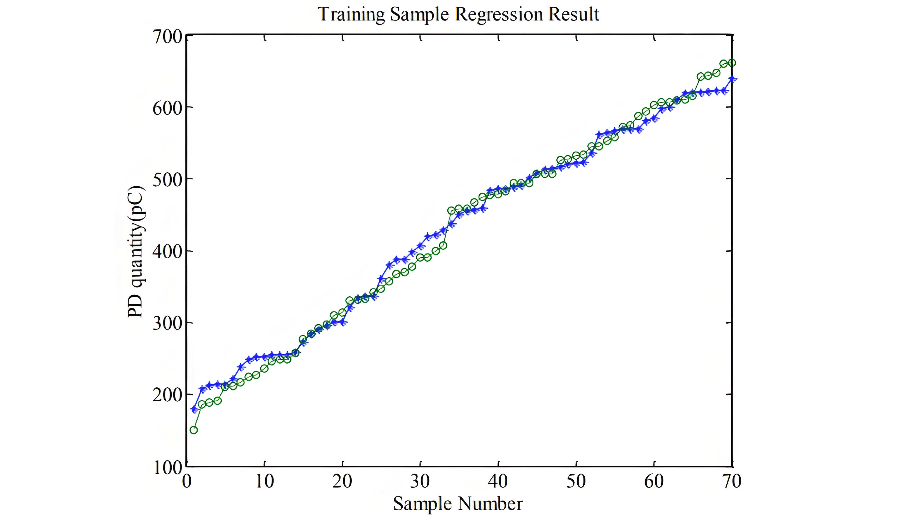
After optimizing the parameters using the genetic algorithm (GA), the same 80 samples are retrained, and the regression result is presented in Fig. 9. As can be seen from Fig. 9, nearly all the samples exhibit a very small error when compared to the measured partial discharge (PD) quantity. The Mean Square Error (MSE) is now 10, which is significantly smaller than the value of 80 before the parameter optimization. Therefore, it is evident that optimizing the GA parameters can effectively reduce the MSE of the regression result and enhance the accuracy of the vector machine.
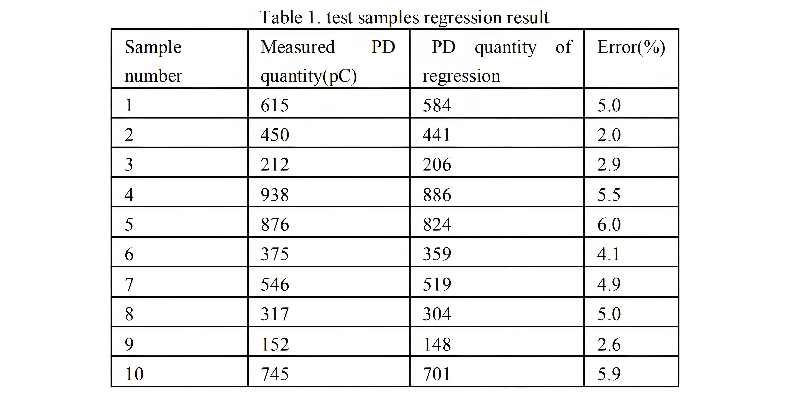
The final 10 samples are employed to conduct a test on the model. The regression results are presented in Table 1. It can be clearly observed that the error between the regression results and the actual partial discharge (PD) quantity is less than 6.1%. This finding indicates that the trained model demonstrates excellent generalization ability.
UV imaging technology is utilized to detect the surface discharge of outdoor vacuum breaker post insulators. The relationship between the facula area in UV images and the partial discharge quantity is explored through the least - square support vector machine method, offering a novel approach for insulation fault diagnosis of outdoor vacuum circuit breakers based on ultraviolet imaging.
After performing L - component threshold segmentation and mathematical morphology operations on UV images, the spot part of the UV image is extracted, enabling the calculation of the facula area. Three parameters are defined to quantify the discharge intensity: the mean facula area, the intermittent facula area, and the repetition times of intermittent faculae.
Once UV videos are captured and the partial discharge (PD) quantity is measured synchronously, the relative humidity and the three UV image feature parameters are used as input variables. Through regression analysis via the least - square support vector machine, along with kernel parameter optimization using a genetic algorithm (GA), the PD quantity can be accurately determined.
By conducting regression analysis to establish the relationship between the insulator surface discharge quantity and its UV image facula area, it is found that the PD quantity diagnosed solely from UV images has an error of less than 6% compared to the measured PD quantity. This level of accuracy meets the requirements of practical applications and provides a new non - invasive method for diagnosing external insulation faults in outdoor vacuum circuit breakers based on ultraviolet imaging.
This research was funded by the National Natural Science Foundation of China and the State Key Laboratory of Electrical Insulation and Power Equipment. The authors would like to express their sincere gratitude to all those who provided support for this project.